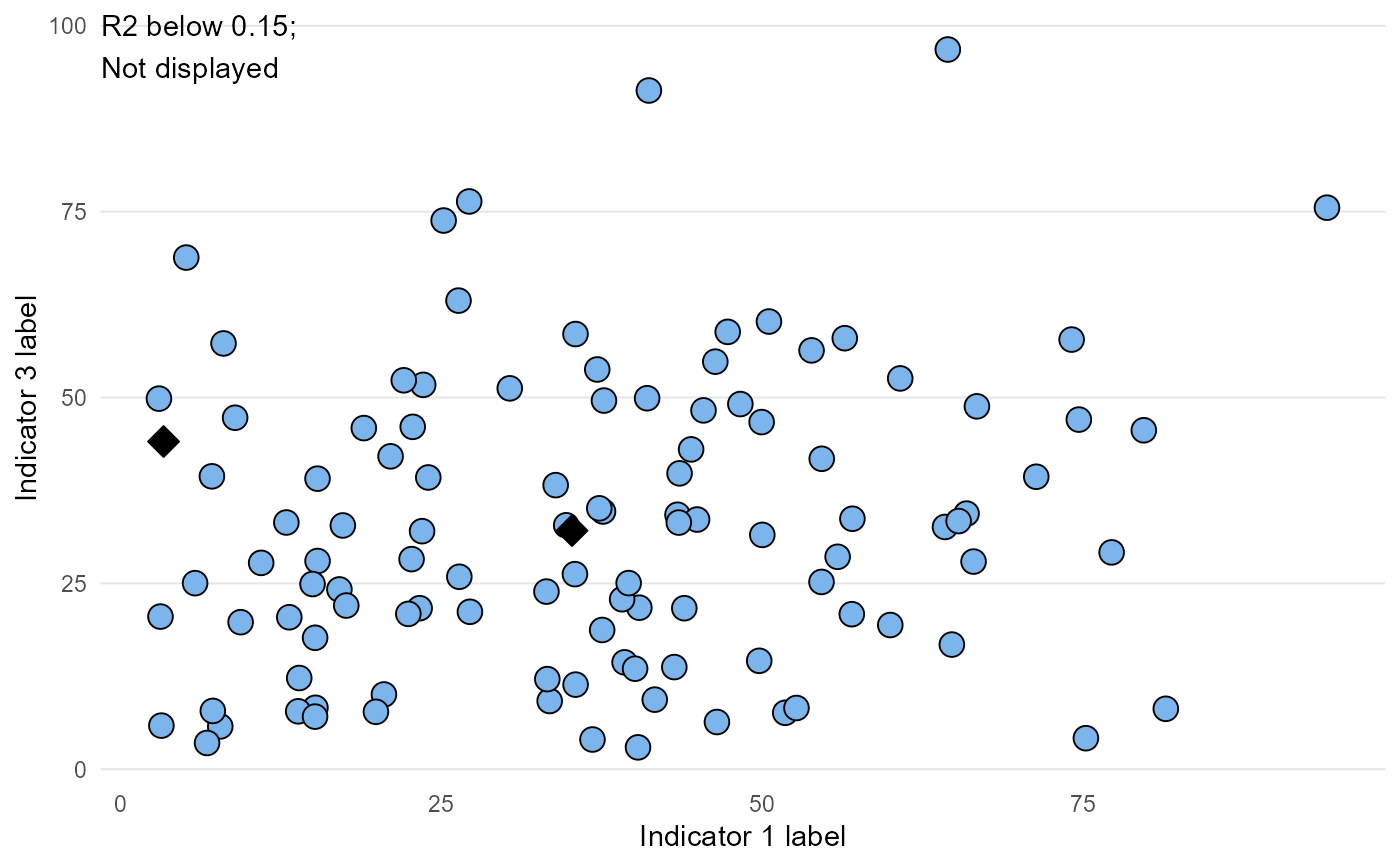
Plot compare indicators plot
compare_indicators(
  data,
  x,
  y,
  xlab = "",
  ylab = "",
  point_size = 4,
  highlight_area,
  area,
  add_R2 = FALSE
)
Arguments
- data
data.frame or tibble which will be fed into ggplot functions. This object should contain the fields used for the arguments within this function
- x
unquoted field name for the field containing x variable
- y
unquoted field name for the field containing y variable
- xlab
string; x-axis title
- ylab
string; y-axis title
- point_size
number; size of point
- highlight_area
character vector; list of areas for highlighting. These ares must be in the area field of the data supplied
- area
unquoted field name for the field containing areas. This is Only required if highlight_area has a value (optional)
- add_R2
logical; should R2 be displayed?
Value
a ggplot object of a scatterplot comparing two indicators
See also
Other quick charts:
box_plots(),
compare_areas(),
map(),
overview(),
population(),
trends()
Examples
library(tidyr)
library(dplyr)
df <- create_test_data()

df_ci <- df %>%
        filter(IndicatorName %in% c("Indicator 1", "Indicator 3")) %>%
        select(IndicatorName, AreaCode, Value) %>%
        pivot_wider(names_from = IndicatorName,
                    values_from = Value) %>%
        rename(Ind1 = `Indicator 1`,
               Ind3 = `Indicator 3`) %>%
        mutate(Ind2 = runif(nrow(.), min = Ind1 * 0.5, max = Ind1 * 1.5))
p <- compare_indicators(df_ci,
                        x = Ind1,
                        y = Ind3,
                        xlab = "Indicator 1 label",
                        ylab = "Indicator 3 label",
                        highlight_area = c("C001", "AC172"),
                        area = AreaCode,
                        add_R2 = TRUE)
p
