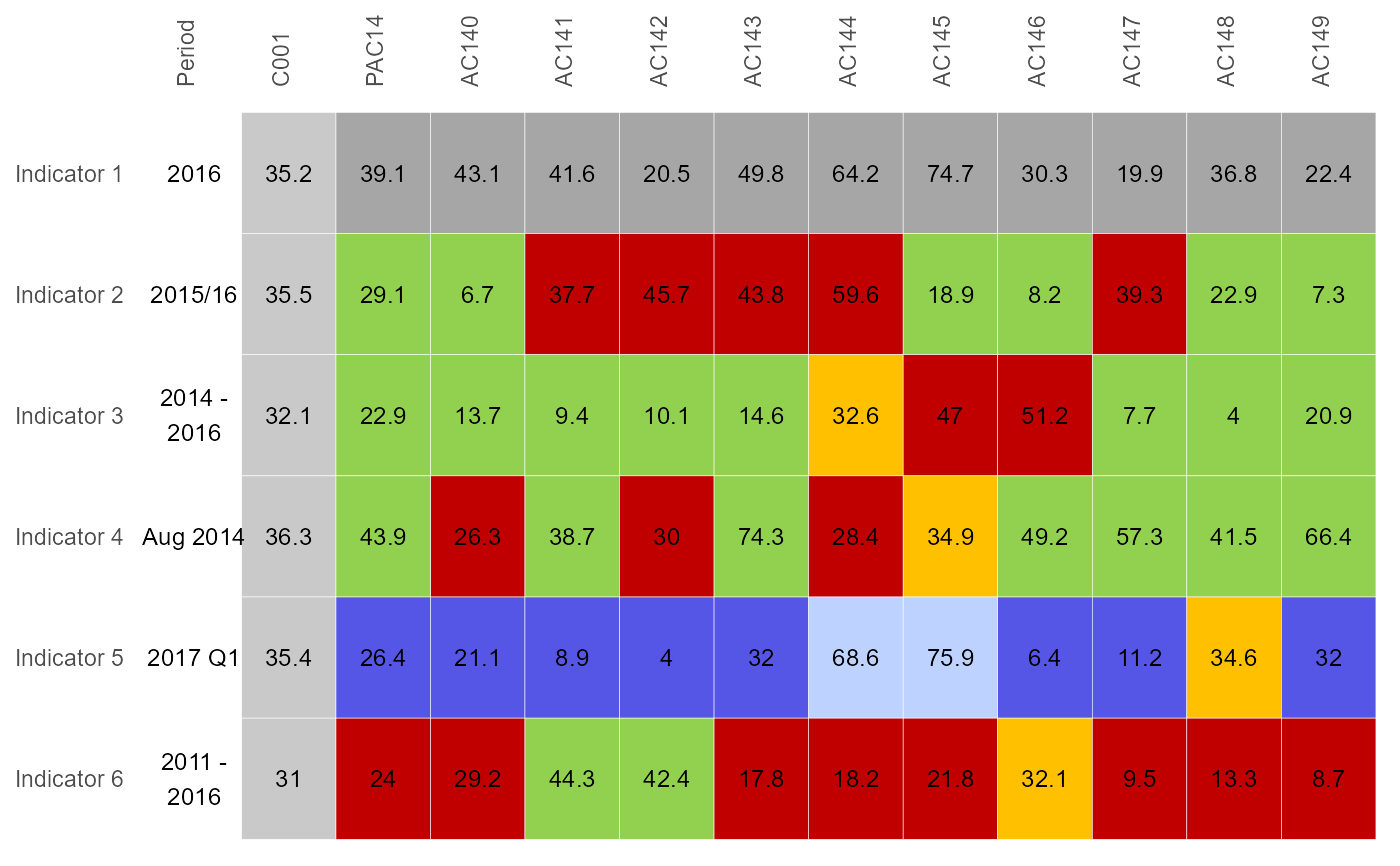
Plot an overview (tartan rug) of multiple indicators
overview(
  data,
  area,
  indicator,
  value,
  fill,
  timeperiod,
  top_areas,
  wrap_length = 50,
  value_label_size = 1,
  legend_position = "none"
)
Arguments
- data
data.frame or tibble which will be fed into ggplot functions. This object should contain the fields used for the arguments within this function
- area
unquoted field name for the field containing area names
- indicator
unquoted field name for the field containing indicator names
- value
unquoted field name for the field containing values for the indicators to be displayed
- fill
unquoted field name for the field to be used to determine the colouring of the bars; usually reflecting significance. The values that values that can be used in this field with predetermined colours are: 'Better', 'Higher', 'Similar', 'Lower', 'Worse', 'Not compared', 'None'
- timeperiod
unquoted field name for the field containing the time period
- top_areas
character vector; controls the areas to be displayed at the top on the left hand side of the chart. The values in the character vector must appear in the field represented by the area argument. Optional
- wrap_length
number; maximum number of characters in the indicator name displayed before the text is wrapped to the next line
- value_label_size
number; controls the size of the label of the value
- legend_position
the position of legends ("none", "left", "right", "bottom", "top", or two-element numeric vector)
Value
a ggplot of the overview/tartan rug plot
See also
Other quick charts:
box_plots(),
compare_areas(),
compare_indicators(),
map(),
population(),
trends()
Examples
library(dplyr)
df <- create_test_data()

parent <- "PAC14"
top_names <- c("C001", parent)
df_over <- df %>%
        filter((AreaCode %in% top_names |
                        ParentAreaCode == parent)) %>%
        mutate(Value = round(Value, 1))
p <- overview(df_over,
              area = AreaCode,
              indicator = IndicatorName,
              value = Value,
              timeperiod = Timeperiod,
              fill = Significance,
              top_areas = top_names,
              wrap_length = 40,
              value_label_size = 0.8)
p